Looking at the stats, there a definite “bump” on the site over the Blogathon. Some of this possibly is from my own access, but not, I suspect, all of it. Big pretty graphs below the fold …
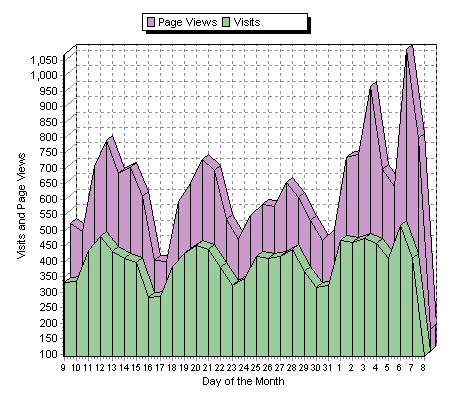
The first graph shows the visits and page views on a daily basis over the last month. Big spike on Saturday. (Not sure what was going on the 3rd.)
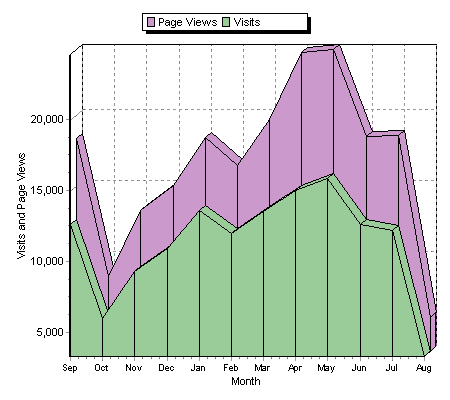
The second graph shows access over the last year (August, of course, is incomplete, thus the big dropoff). June/July have been slack months, due perhaps to school being out, but more likely due to a decrease in posts those months, as I’ve been travelling and as my free time to do this has been more constrained. (The Oct/Nov dip had to do with not having the counter code on my individual pages after I switched over to dynamic pages with MT3.)
Take it all for what it’s worth.