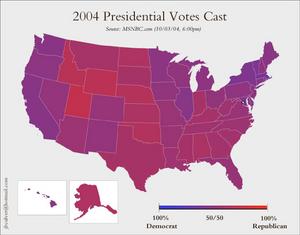
 While the electoral college system encourages a binary blue/red split, this map (click on it) gives a bit more, ah, nuanced approach, letting the color tones within each state reflect the balance of popular vote, not electoral.
Yes, there are broad patterns — a more red-violet in the south and Midwest, pretty much red through the northern mountain states, more blue and purple along the coast — but it makes things a lot more clearly muddled, too, if that makes sense. If only there weren’t a typo up in the date, it would be perfect. If nothing else, it shows that even if you think the Other Side is nothing but a flock of whackos, there’s plenty of Your Side hanging out there, too — unless you live in Utah, or Massachusetts.
(via BoingBoing)
UPDATE: It occurs to me that this map demonstrates one of the biggest weaknesses/strengths of the electoral college system. On the one hand, it overemphasizes the size of victories, lending a certain added air of legitimacy to the winner, usually a good thing. On the other hand, it overemphasizes the size of victories, making the voting seem much more divisive than it may actually be.
Sweet — similar map, but broken down to the county level. Much more blended and, ahem, nuanced.
oooo…
I like the new one!
BTW Boulder county is still below half the votes counted.
Also the 5280 blog has some county voting break downs that are interesting to read.
I would like to see the 2000 and 2004 overlaid on top of each other to sort out any trends. My county (Larimer) looks almost a perfect purple. Warms my moderate heart.
That 5280.com article can be found here.
Here’s a pair of maps (no overlay, alas) that compare by counties in 2004 vs 2000.
Interestlingly, from a county area PoV, Bush won 2.51 million square milies, and Kerry 0.51 million square miles (and that doesn’t include Alaska, which doesn’t report by counties). That certainly emphasizes the urban vs non-urban demographic split.
Since it didn’t trackback here properly, a mention from the Flea.
I am rather proud of the post title, myself.